The Black Hat Network Operations Center (NOC) provides a high security, high availability network in one of the most demanding environments in the world – the Black Hat event.
The NOC partners are selected by Black Hat, with Arista, Cisco, Corelight, Lumen, NetWitness and Palo Alto Networks delivering from Las Vegas this year. We appreciate Iain Thompson of The Register, for taking time to attend a NOC presentation and tour the operations. Check out Iain’s article: ‘Inside the Black Hat network operations center, volunteers work in geek heaven.’
We also provide integrated security, visibility and automation: a SOC (Security Operations Center) inside the NOC, with Grifter and Bart as the leaders.
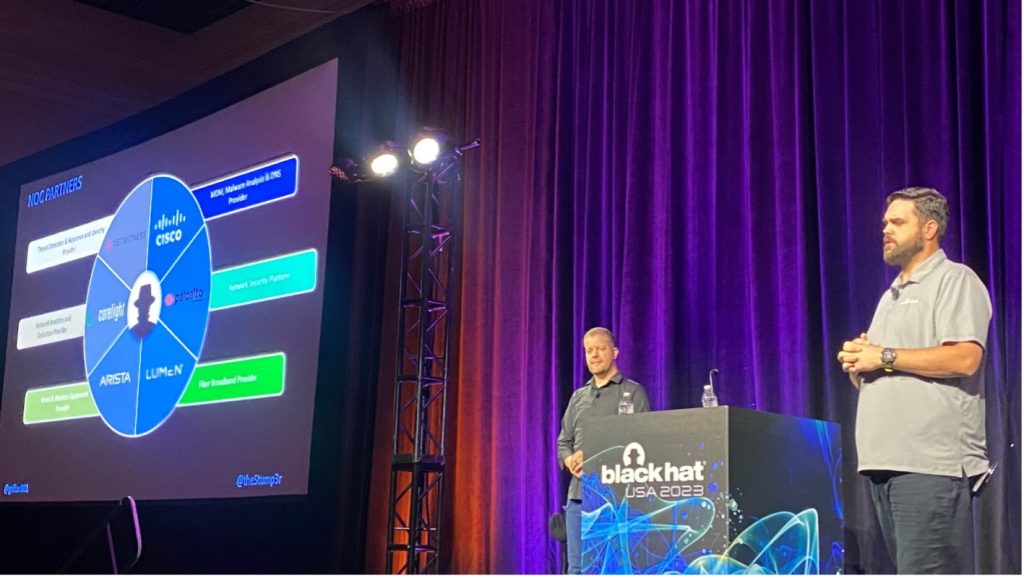
Integration is key to success in the NOC. At each conference, we have a hack-a-thon: to create, prove, test, improve and finally put into production new or improved integrations. To be a NOC partner, you must be willing to collaborate, share API (Automated Programming Interface) keys and documentation, and come together (even as market competitors) to secure the conference, for the good of the attendees.

XDR (eXtended Detection and Response) Integrations
At Black Hat USA 2023, Cisco Secure was the official Mobile Device Management, DNS (Domain Name Service) and Malware Analysis Provider. We also deployed ThousandEyes for Network Assurance.
As the needs of Black Hat evolved, so have the Cisco Secure Technologies in the NOC:
- Cisco XDR: threat intelligence aggregation
- ThousandEyes: Network Assurance
- Cisco Umbrella: DNS visibility and security
- Cisco Secure Malware Analytics (Formerly Threat Grid): sandboxing and integrated threat intelligence
- Cisco Secure Cloud Analytics (Formerly Stealthwatch Cloud): network traffic visibility and threat detection
- Cisco Webex: incident delivery and team collaboration
- Cisco Security Connector: iOS device security and visibility, connected with Meraki Systems Manager
The Cisco XDR dashboard made it easy to see the status of each of the connected Cisco Secure technologies, and the status of ThousandEyes agents.
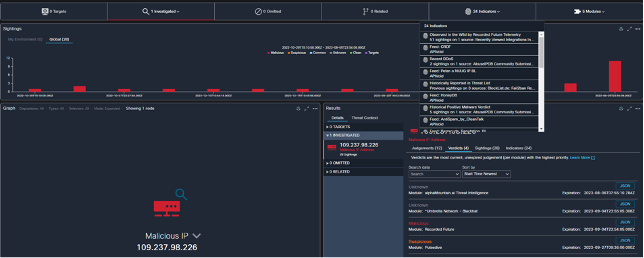
Below are the Cisco XDR integrations for Black Hat USA, empowering analysts to investigate Indicators of Compromise (IOC) very quickly, with one search. We appreciate alphaMountain.ai, Pulsedive and Recorded Future donating full licenses to the Black Hat USA 2023 NOC.

For example, an IP tried AndroxGh0st Scanning Traffic against the Registration server, blocked by Palo Alto Networks firewall.
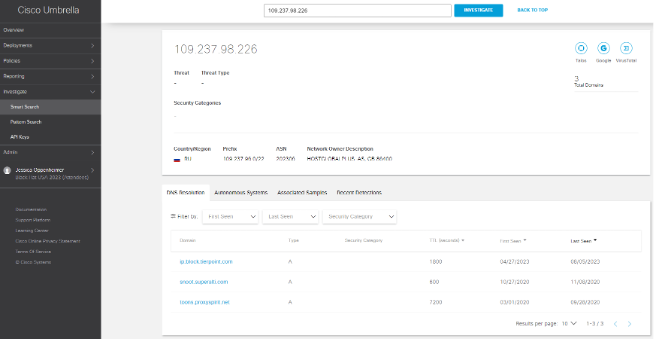
Investigation of the IP confirmed it was known malicious.
Also, the geo location in RU and known affiliated domains. With this information, the NOC leadership approved the shunning of the IP.
File Analysis and Teamwork in the NOC
Corelight and NetWitness extracted nearly 29,000 files from the conference network stream, which were sent for analysis in Cisco Secure Malware Analytics (Threat Grid).

It was humorous to see the number of Windows update files that were downloaded at this premier cybersecurity conference. When file was convicted as malicious, we would investigate the context:
- Is it from a classroom, where the topic is related to the behavior of the malware?
- Or, is from a briefing or a demo in the Business Hall?
- Is it propagating or confined to that single area?
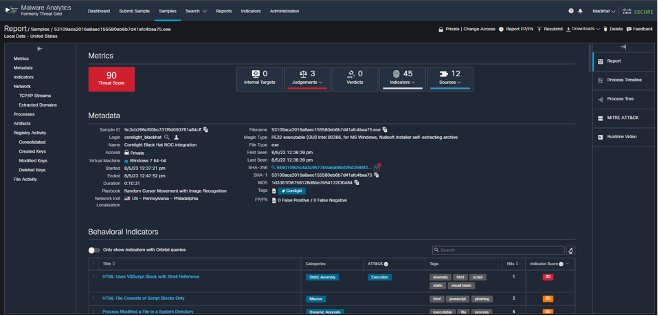
The sample above was submitted by Corelight and investigation confirmed multiple downloads in the training class Windows Reverse Engineering (+Rust) from Scratch (Zero Kernel & All Things In-between), an authorized activity.

The ABCs of XDR in the NOC, by Ben Greenbaum
One of the many Cisco tools in our Black Hat kit was the newly announced Cisco XDR. The powerful, multi-faceted and dare I say it “extended” detection and response engine allowed us to easily meet the following goals:

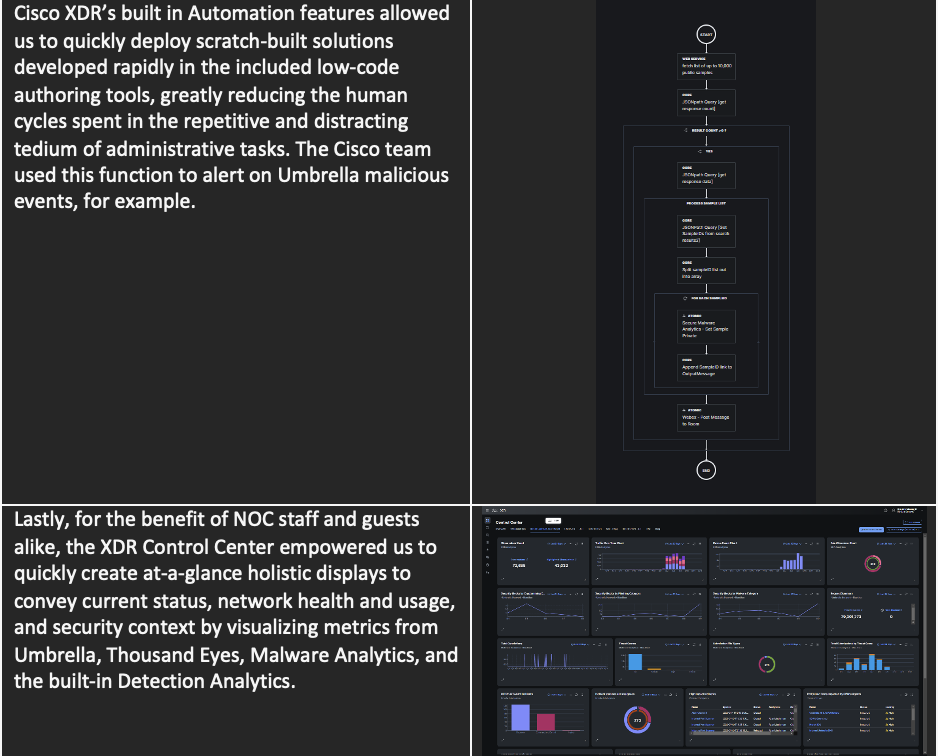
One of the less public-facing benefits of this unique ecosystem is the ability for our engineers and product leaders to get face time with our peers at partner organization, including those that would normally – and rightfully – be considered our competitors. As at Black Hat events in the past, I got to participate in meaningful conversations about the intersection of usage of Cisco and 3rd party products, tweak our API plans and clearly express the needs we have from our partner technologies to better serve our customers in common. This collaborative, cooperative project allows all our teams to improve the way our products work, and the way they work together, for the betterment of our customers’ abilities to meet their security objectives. Truly a unique situation and one in which we are grateful to participate.
Secure Cloud Analytics in XDR, by Adi Sankar
Secure Cloud Analytics (SCA) allows you to gain the visibility and continuous threat detection needed to secure your public cloud, private network and hybrid environment. SCA can detect early indicators of compromise in the cloud or on-premises, including insider threat activity and malware, as well as policy violations, misconfigured cloud assets, and user misuse. These NDR (Network Detection and Response) capabilities have now become native functionality within Cisco XDR. Cisco XDR was available starting July 31st 2023, so it was a great time to put it through its paces at the Black Hat USA conference in August.
Cisco Telemetry Broker Deployment
Cisco Telemetry Broker (CTB) routes and replicates telemetry data from a source location(s) to a destination consumer(s). CTB transforms data protocols from the exporter to the consumer’s protocol of choice and because of its flexibility CTB was chosen to pump data from the Black Hat network to SCA.
Typically, a CTB deployment requires a broker node and a manager node. To reduce our on-prem foot print I proactively deployed a CTB manager node in AWS (Amazon Web Services) (although this deployment is not available for customers yet, cloud managed CTB is on the roadmap). Since the manager node was deployed already, we only had to deploy a broker node on premise in ESXi.
With the 10G capable broker node deployed it was time to install a special plugin from engineering. This package is not available for customers and is still in beta, but we are lucky enough to have engineering support to test out the latest and greatest technology Cisco has to offer (Special shoutout to Junsong Zhao from engineering for his support). The plugin installs a flow sensor within a docker container. This allows CTB to ingest a SPAN from an Arista switch and transform it to IPFIX data. The flow sensor plugin (formerly Stealthwatch flow sensor) uses a combination of deep packet inspection and behavioral analysis to identify anomalies and protocols in use across the network.
In addition to the SPAN, we requested that Palo Alto send NetFlow from their Firewalls to CTB. This allows us to capture telemetry from the edge devices’ egress interface giving us insights into traffic from the external internet, inbound to the Blackhat network. In the CTB manager node I configured both inputs to be exported to our SCA tenant.


 Private Network monitoring in the cloud
First, we need to configure SCA by turning on all the NetFlow based alerts. In this case it was already done since we used the same tenant for a Blackhat Singapore. However, this action can be automated using the API api/v3/alerts/publish_preferences/ by setting both “should_publish” and “auto_post_to_securex” to true in the payload. Next, we need to configure entity groups in SCA to correspond with internal Blackhat network. Since subnets can change conference to conference, I automated this configuration using a workflow in XDR Automate.

The subnets are documented in a CSV file from which the workflow parses 3 fields: the CIDR of the subnet, a name and a description. Using these fields to execute a POST call to the SCA /v3/entitygroups/entitygroups/ API creates the corresponding entity groups. Much faster than manually configuring 111 entity groups!

Now that we have network telemetry data flowing to the cloud SCA can create detections in XDR. SCA starts with observations which turn into alerts which are then correlated into attack chains before finally creating an Incident. Once the incident is created it is submitted for priority scoring and enrichment. Enrichment queries the other integrated technologies such as Umbrella, Netwitness and threat intelligence sources about the IOC’s from the incident, bringing in additional context.

SCA detected 289 alerts including Suspected Port Abuse, Internal Port Scanner, New Unusual DNS Resolver,and Protocol Violation (Geographic). SCA correlated 9 attack chains including one attack chain with a total of 103 alerts and 91 hosts on the network. These attack chains were visible as incidents within the XDR console and investigated by threat hunters in the NOC.

Conclusion
Cisco XDR collects telemetry from multiple security controls, conducts analytics on that telemetry to arrive at a detection of maliciousness, and allows for an efficient and effective response to those detections. We used Cisco XDR to its fullest in the NOC from automation workflows, to analyzing network telemetry, to aggregating threat intelligence, investigating incidents, keeping track of managed devices and much more!
Hunter summer camp is back. Talos IR threat hunting during Black Hat USA 2023, by Jerzy ‘Yuri’ Kramarz
This is the second year Talos Incident Response is supporting Network Operations Centre (NOC) during the Black Hat USA conference, in a threat hunting capacity.

My objective was to use multi-vendor technology stacks to detect and stop ongoing attacks on key infrastructure externally and internally and identify potential compromises to attendees’ systems. To accomplish this, the threat hunting team focused on answering three key hypothesis-driven questions and matched that with data modeling across different technology implementations deployed in the Black Hat NOC:
- Are there any attendees attempting to breach each other’s systems in or outside of a classroom environment?
- Are there any attendees attempting to subvert any NOC Systems?
- Are there any attendees compromised, and could we warn them?
Like last year, analysis started with understanding how the network architecture is laid out, and what kind of data access is granted to NOC from various partners contributing to the event. This is something that changes every year.
Great many thanks go to our friends from NetWitness, Corelight, Palo Alto Networks, Arista and Mandiant and many others, for sharing full access to their technologies to ensure that hunting wasn’t contained to just Cisco equipment and that contextual intelligence could be gathered across different security products. In addition to technology access, I also received great help and collaboration from partner teams involved in Black Hat. In several cases, multiple teams were contributing technical expertise to identify and verify potential signs of compromise.
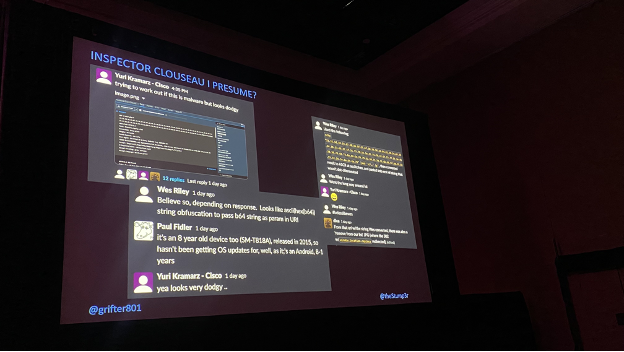
For our own technology stack, Cisco offered access to Cisco XDR, Meraki, Cisco Secure Malware Analytics, Thousands Eyes, Umbrella and Secure Cloud Analytics (formerly known as StealthWatch).
The Hunt
Our daily threat hunt started with gathering data and looking at the connections, packets and various telemetry gathered across the entire network security stack in Cisco technologies and other platforms, such as Palo Alto Networks or NetWitness XDR. Given the infrastructure was an agglomeration of various technologies, it was imperative to develop a threat hunting process which supported each of the vendors. By combining access to close to 10 different technologies, our team gained a greater visibility into traffic, but we also identified a few interesting instances of different devices compromised on the Black Hat network.
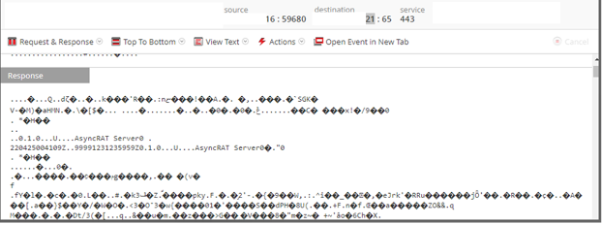
One such example was an AsyncRat-compromised system found with NetWitness XDR, based on a specific keyword located in the SSL certificate. As seen in the screenshot below, the tool allows for powerful deep-packet-inspection analysis.
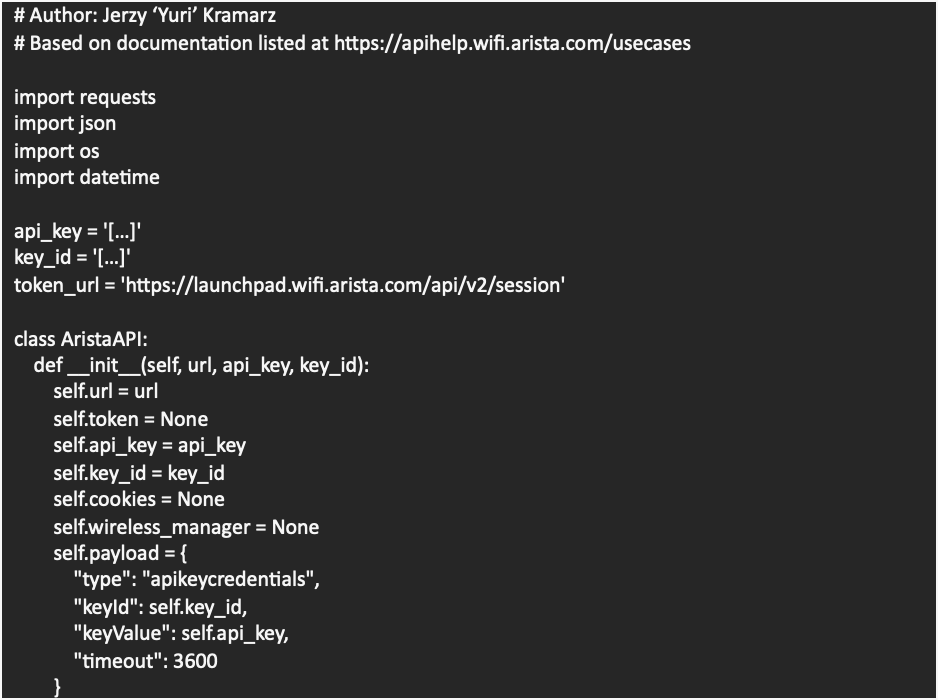
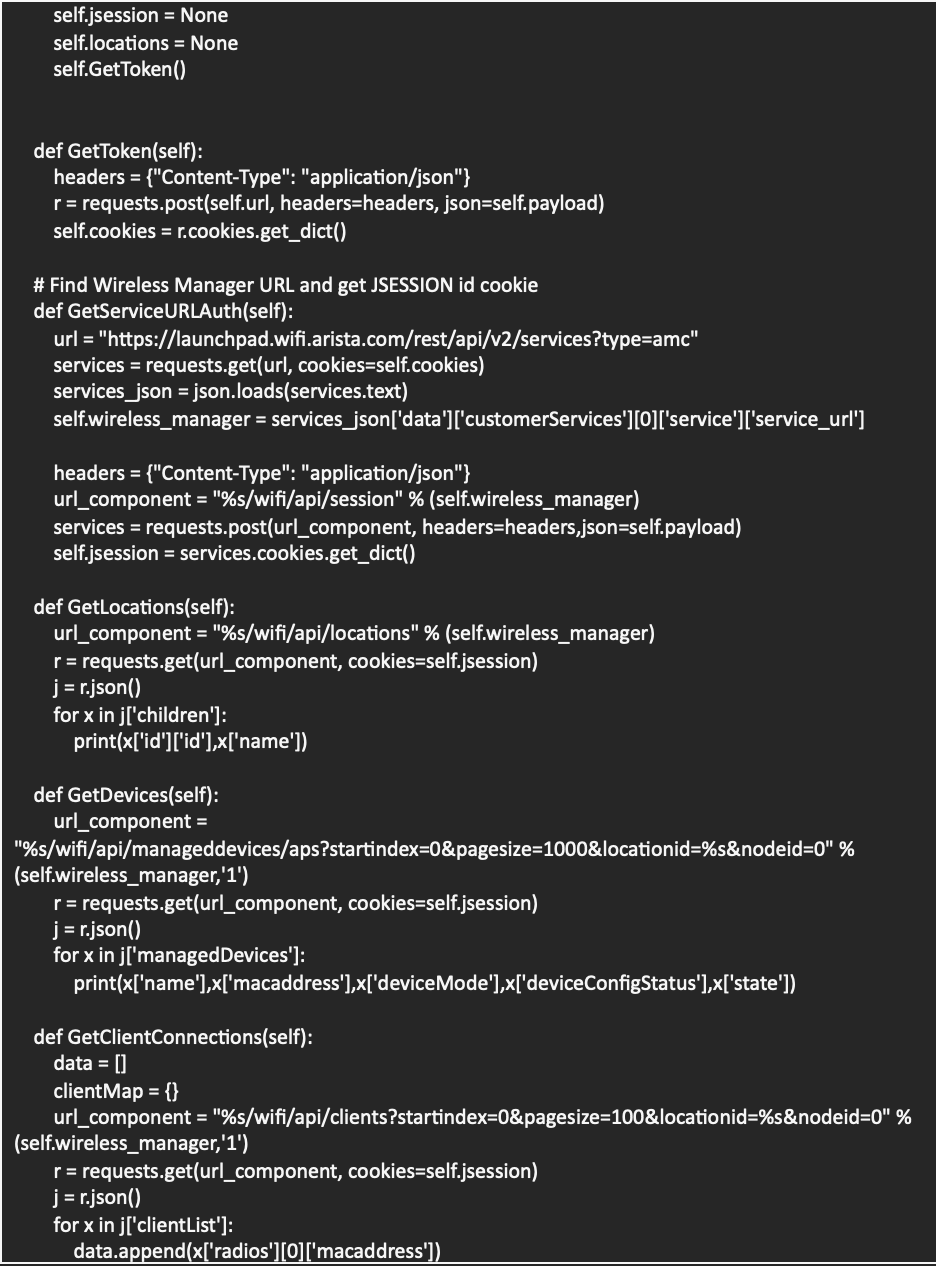
After positive identification of the AsyncRat activity, we used the Arista wireless API to track the user to a specific training room and notified them about the fact that their device appeared to be compromised. Sometimes these types of activities can be part of a Black Hat training classes, but in this case, it seemed evident that the user was unaware of the legitimate compromise. This little snippet of code helped us find out where attendees were in the classrooms, based on Wireless AP connection, so we could notify them about their compromised systems.

Throughout our analysis we also identified another instance of direct malware compromise and related network communication which matched the activity of an AutoIT.F trojan communicating over a command and control (C2) to a well-know malicious IP [link to a JoeBox report]. The C2 the adversary used was checking on TCP ports 2842 and 9999. The example of AutoIT.F trojan request, observed on the network can be found below.
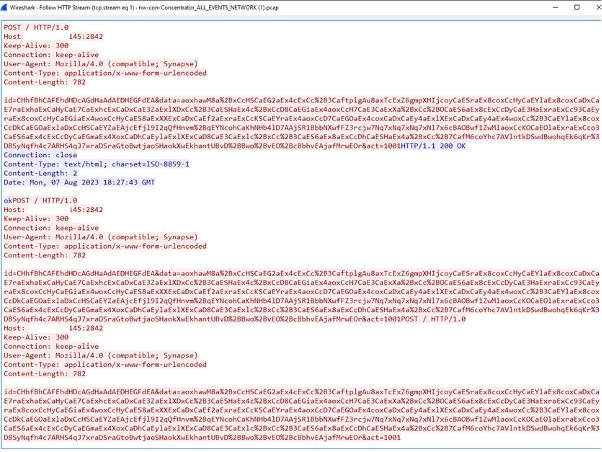
Above traffic sample was decoded, to extract C2 traffic record and the following decoded strings appeared to be the final payload. Notice that the payload included hardware specification, build details and system name along with other details.

Likewise, in this case, we managed to track the compromised system through the Wi-Fi connection and notifiy the user that their system appeared to be compromised.
Clear Text authentication still exists in 2023
Although not directly related to malware infection, we did discover a few other interesting findings during our threat hunt, including numerous examples of clear text traffic disclosing email credentials or authentication session cookies for variety of applications. In some instances, it was possible to observe clear-text LDAP bind attempts which disclosed which organization the device belonged to or direct exposure of the username and password combination through protocols such as POP3, LDAP, HTTP (Hyper Text Transfer Protocol) or FTP. All these protocols can be easily subverted by man-in-the-middle (MitM) attacks, allowing an adversary to authenticate against services such as email. Below is an example of the plain text authentication credentials and other details observed through various platforms available at Black Hat.
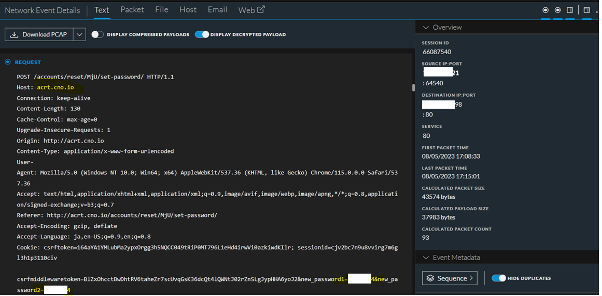
Other examples of clear text disclosure were observed via basic authentication which simply used base64 to encode the credentials transmitted over clear text. An example of this was noticed with an Urban VPN (Virtual Private Network) provider which appears to grab configuration files in clear text with basic authentication.

A few other instances of various clear text protocols such as IMAP were also identified on the network, which we were surprised to still be use in 2023.

What was interesting to see is that several modern mobile applications, such as iPhone Mail, are happy to accept poorly configured email servers and use insecure services to serve basic functionalities, such as email reading and writing. This resulted in numerous emails being present on the network, as seen below:

This year, we also identified several mobile applications that not only supported insecure protocols such as IMAP, but also performed direct communication in clear text, communicating everything in clear text, including user pictures, as noted below:
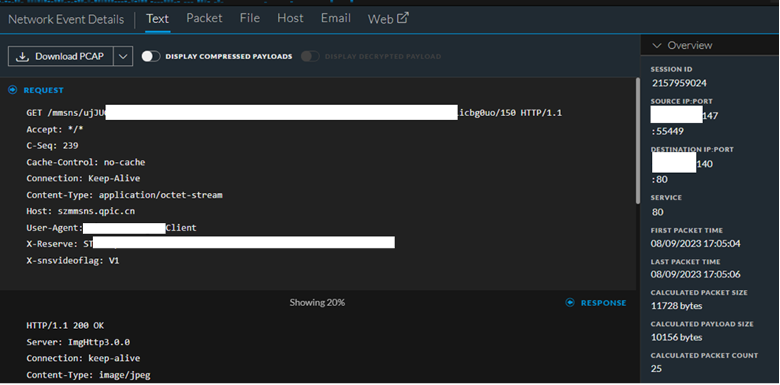
In several instances, the mobile application also transmitted an authentication token in clear text:

Even more interesting was the fact that we have identified a few vendors attempting to download links to patches over HTTP, as well. In some instances, we have seen original requests sent over HTTP protocol with the “Location” header response in clear text pointing to an HTTPS location. Although I would expect these patches to be signed, communicating over HTTP makes it quite easy to modify the traffic in MitM scenario to redirect downloads to separate locations.


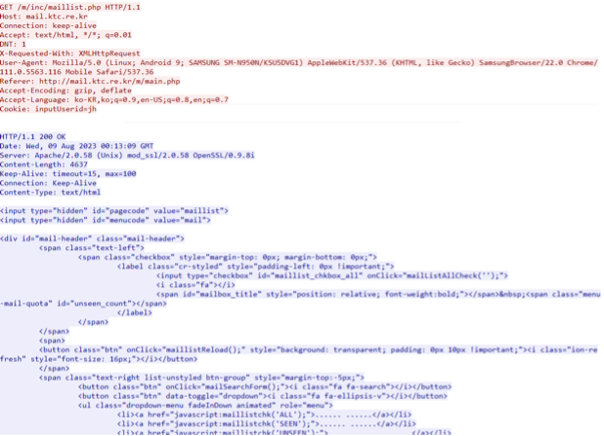
There were numerous other examples of HTTP protocol used to perform operations such as reading emails through webmail portals or downloading PAC files which disclose internal network details as noted on the screenshots below.

Cisco XDR technology in action
In addition to the usual technology portfolio offered by Cisco and its partners, this year was also the first year I had the pleasure of working with Cisco XDR console, which is a new Cisco product. The idea behind XDR is to give a single “pane of glass” overview of all the different alerts and technologies that work together to secure the environment. Some of Cisco’s security products such as Cisco Secure Endpoint for iOS and Umbrella were connected to via XDR platform and shared their alerts, so we could use these to gain a quick understanding of everything that is happening on network from different technologies. From the threat hunting perspective, this allows us to quickly see the state of the network and what other devices and technologies might be compromised or execute suspicious activities.
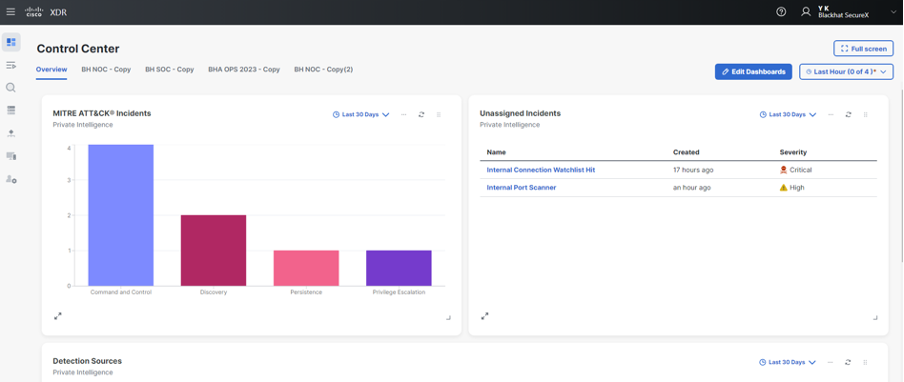

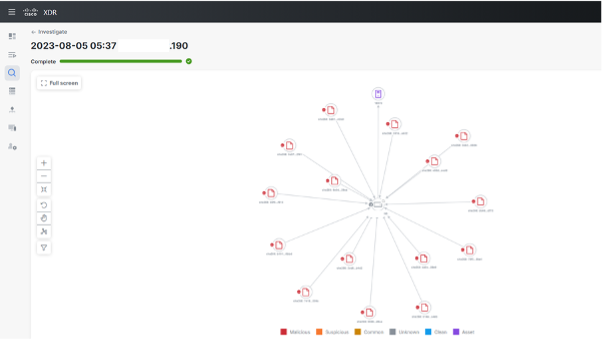
While looking at internal traffic, we also found and plotted quite a few different port scans running across the internal and external network. While we would not stop these unless they were sustained and egregious, it was interesting to see different attempts by students to find ports and devices across networks. Good thing that network isolation was in place to prevent that.
The example below shows quick external investigation using XDR, which resulted in successful identification of this type of activity. What triggered the alert was a series of events which identified scanning and the fact that suspected IP also had relationships with several malicious files seen in VirusTotal:

Based on this analysis, we quickly confirmed that port scanning is indeed valid and determined which devices were impacted, as seen below. This, combined with visibility from other tools such as Palo Alto Networks boundary firewalls, gave us stronger confidence in our raised alerts. The extra contextual information related to malicious files also allowed us to confirm that we are dealing with a suspicious IP.
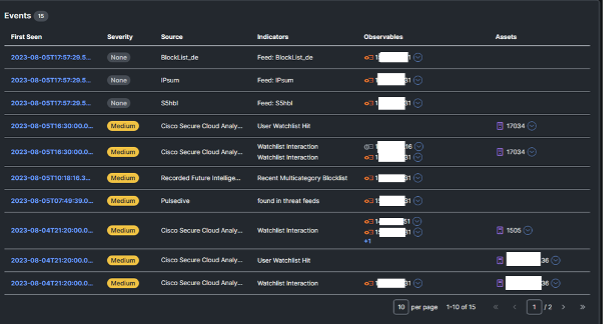
Throughout the Black Hat conference, we saw many different attacks spanning across different endpoints. It was helpful to be able to filter on these attacks quickly to find where the attack originated and whether it was a true positive.

Using the above view, it was also possible to directly observe what contributed to the calculation of malicious score and what sources of threat intelligence could be used to identify how was the malicious score calculated for each of the components that made up the overall alert.
It’s not just about internal networks
In terms of the external attacks, Log4J, SQL injections, OGLN exploitation attempts, and all kinds of enumeration were a daily occurrence on the infrastructure and the applications used for attendee registration, along with other typical web-based attacks such as path traversals. The following table summarizes some of the observed some of the successfully blocked attacks where we have seen the biggest volume. Again, our thanks to Palo Alto Networks for giving us access to their Panorama platform, so we can observe various attacks against the Black Hat infrastructure.

Overall, we saw a sizeable number of port scans, floods, probes and all kinds of web application exploitation attempts showing up daily at various peak hours. Fortunately, all of them were successfully identified for context (is this part of a training class or demonstration?) and contained (if appropriate) before causing any harm to external systems. We even had a suspected Cobalt Strike server (179.43.189[.]250) [link to VirusTotal report] scanning our infrastructure and looking for specific ports such as 2013, 2017, 2015 and 2022. Given the fact that we could intercept boundary traffic and investigate specific PCAP (packet capture) dumps, we used all these attacks to identify various C2 servers for which we also hunted internally, to ensure that no internal system is compromised.

Network Assurance, by Ryan MacLennan and Adam Kilgore
Black Hat USA 2023 is the first time we deployed a new network performance monitoring solution named ThousandEyes. There was a proof of concept of ThousandEyes capabilities at Black Hat Asia 2023, investigating a report of slow network access. The investigation identified the issue was not with the network, but with the latency in connecting to a server in Ireland from Singapore. We were asked to proactively bring this network visibility and assurance to Las Vegas.
ThousandEyes utilizes both stationary Enterprise Agents and mobile Endpoint Agents to measure network performance criteria like availability, throughput, and latency. The image below shows some of the metrics captured by ThousandEyes, including average latency information in the top half of the image, and Layer 3 hops in the bottom half of the image with latency tracked for each network leg between the Layer 3 hops.
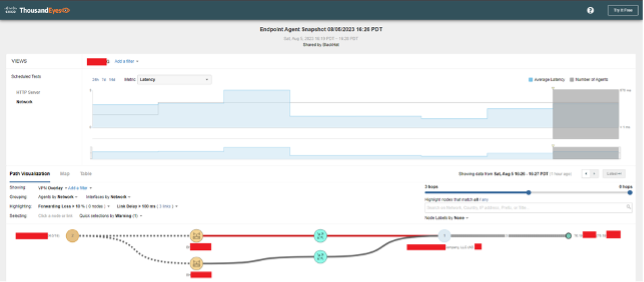
The ThousandEyes web GUI can show data for one or many TE agents. The screenshot below shows multiple agents and their respective paths from their deployment points to the Black Hat.com website.

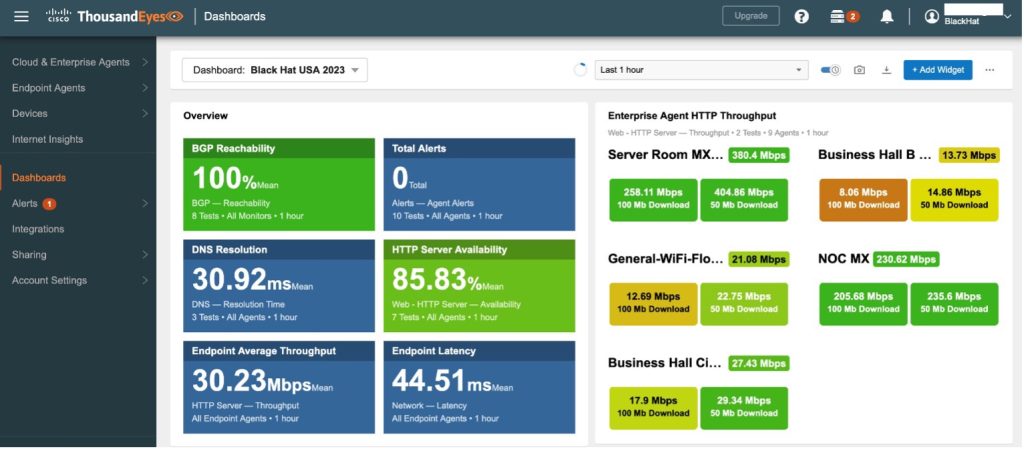
We also created a set of custom ThousandEyes dashboards for the Black Hat convention that tracked aggregate metrics for all of the deployed agents.
ThousandEyes Deployment
Ten ThousandEyes Enterprise Agents were deployed for the conference. These agents were moved throughout different conference areas to monitor network performance for important events and services. Endpoint Agents were also deployed on laptops of NOC technical associate personnel and used for mobile diagnostic information in different investigations.
Coming into Black Hat with knowledge of how the conference will be set up was key in determining how we would deploy ThousandEyes. Before we arrived at the conference, we made a preliminary plan on how we would deploy agents around the conference. This included what kind of device would run the agent, the connection type, and rough locations of where they would be set up. In the image below you can see we planned to deploy ThousandEyes agents on Raspberry Pi’s and a Meraki MX appliance

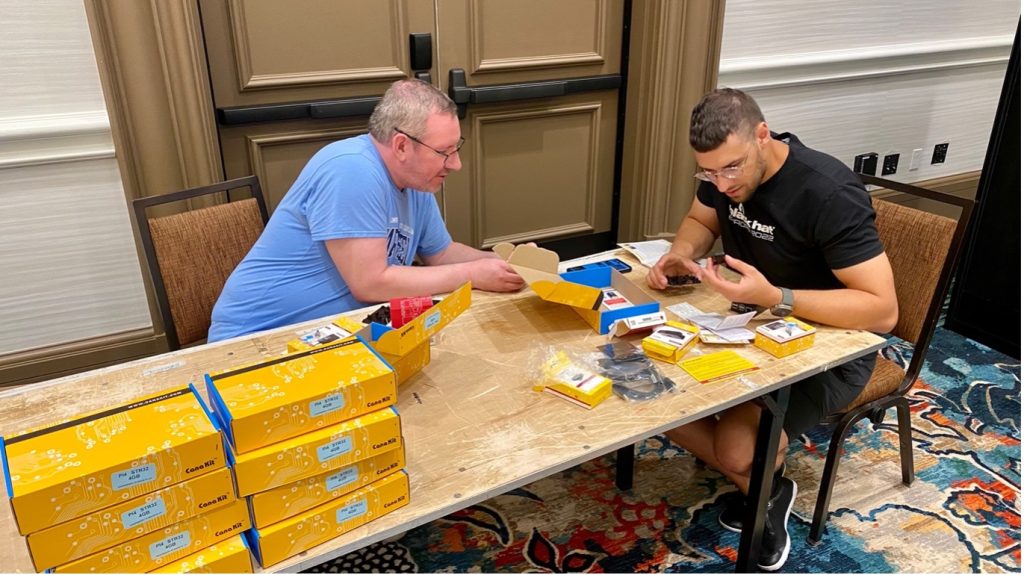
The plan was to run all the agents on the wireless network. Once we arrived at the conference, we started prepping the Pi’s for the ThousandEyes image that was provided in the UI (User Interface). The below image shows us getting the Pi’s out of their packaging and setting them up for the imaging process. This included installing heatsinks and a fan.
After all the Pi’s were prepped, we started flashing the ThousandEyes (TE) image onto each SD-Card. After flashing the SD-Cards, we needed to boot them up, get them connected to the dashboard and then work on enabling the wireless. While we had a business case that called for wireless TE agents on Raspberry Pi, we did have to clear a hurdle or wireless not being officially supported for the Pi TE agent. We had to go through a process of unlocking (jailbreaking) the agents, installing multiple networking libraries to enable the wireless interface, and then create boot up scripts to start the wireless interface, get it connected, and change the routing to default to the wireless interface. You can find the code and guide at this GitHub repository.
We confirmed that the wireless configurations were working properly and that they would persist across boots. We started deploying the agents around the conference as we planned and waited for them all to come up on our dashboard. Then we were ready to start monitoring the conference and provide Network Assurance to Black Hat. At least that is what we thought. About 30 minutes after each Pi came up in our dashboard, it would mysteriously go offline. Now we had some issues we needed to troubleshoot.
Troubleshooting the ThousandEyes Raspberry Pi Deployment
Now that our Pi’s had gone offline, we needed to figure out what was going on. We took some back with us and let them run overnight with one using a wired connection and one on a wireless connection. The wireless one did not stay up all night, while the wired one did. We noticed that the wireless device was significantly hotter than the wired one and this led us to the conclusion that the wireless interface was causing the Pi’s to overheat.
This conundrum had us confused because we have our own Pi’s, with no heatsinks or fans, using wireless at home and they never overheat. One idea we had was that the heatsinks were not cooling adequately because the Pi kits we had used a thermal sticker instead of thermal paste and clamp like a typical computer. The other was that the fan was not pushing enough air out of the case to keep the internal temperature low. We reconfigured the fan to use more voltage and flipped the fan from pulling air out of the case to pushing air in and onto the components. While a fan placed directly on a CPU should pull the hot air off the CPU, orienting the Raspberry Pi case fan to blow cooler air directly onto the CPU can result in lower temperatures. After re-orienting the fan, to blow onto the CPU, we did not have any new heating failures.
Running a couple of Pi’s with the new fan configuration throughout the day proved to be the solution we needed. With our fixed Pi’s now staying cooler, we were able to complete a stable deployment of ThousandEyes agents around the conference.
ThousandEyes Use Case
Connectivity problems with the training rooms were reported during the early days of the conference. We utilized several different methods to collect diagnostic data directly from the reported problem areas. While we had ThousandEyes agents deployed throughout the conference center, problem reports from individual rooms often required a direct approach that brought a TE agent directly to the problem area, often targeting a specific wireless AP (Access Points) to collect diagnostic data from.
One specific use case involved a report from the Jasmine G training room. A TE engineer traveled to Jasmine G and used a TE Endpoint Agent on a laptop to connect to the Wi-Fi using the PSK assigned to the training room. The TE engineer talked to the trainer, who shared a specific web resource that their training session depended on. The TE engineer created a specific test for the room using the online resource and collected diagnostic data which showed high latency.
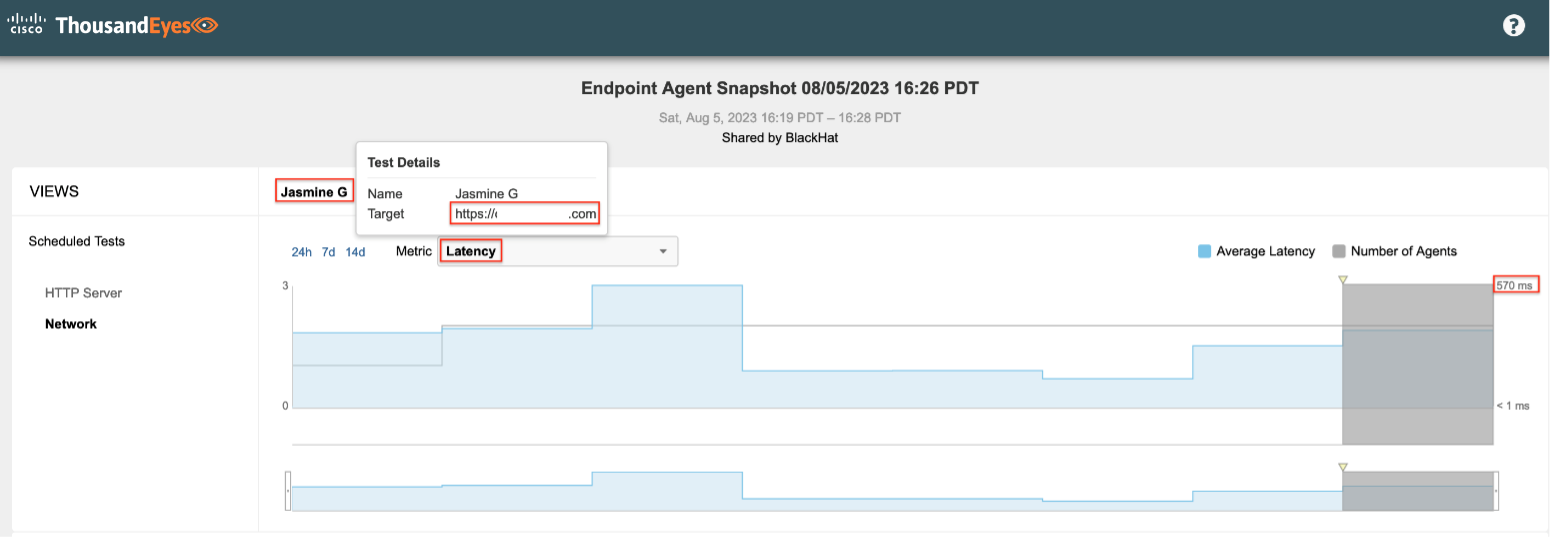
During the collection of the data, the TE agent connected to two different wireless access points near the training room and collected latency data for both paths. The connection through one of the APs showed significantly higher latency than the other AP, as indicated by the red lines in the image below.

ThousandEyes can generate searchable reports based on test data, such as the data shown in the prior two screenshots. After capturing the test data above, a report was generated for the dataset and shared with the wireless team for troubleshooting.
Mobile Device Mangement, by Paul Fidler and Connor Loughlin
For the seventh consecutive Black Hat conference, we provided iOS mobile device management (MDM) and security. At Black Hat USA 2023, we were asked to manage and secure:
- Registration: 32 iPads
- Session Scanning: 51 iPads
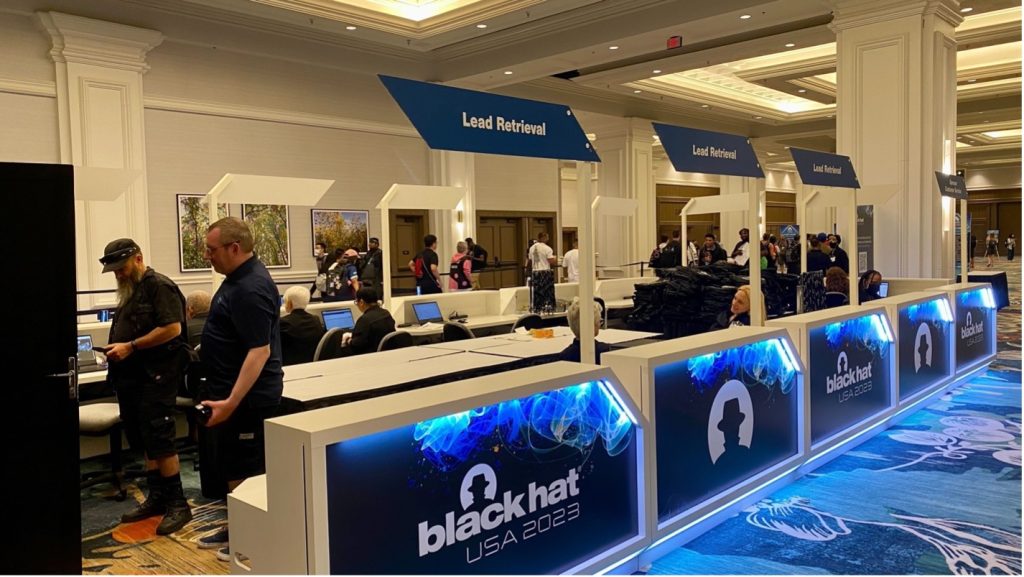
- Lead Retrieval: 550 iPhones and 300 iPads

When we arrived for set up three days before the start of the training classes, our mission was to have a network up and running as soon as is humanly possible, so start managing the 900+ devices and check their status.
Wi-Fi Considerations
We had to adjust our Wi-Fi authentication schema. In the prior four Black Hat conferences, the iOS devices were provisioned with a simple PSK based SSID that was available everywhere throughout the venue. Then, as they enrolled, they were also pushed a certificate / Wi-Fi policy (where the device then went off and requested a cert from a Meraki Certificate Authority, ensuring that the private key resided securely on the device. At the same time, the certificate name was also written into Meraki’s Cloud Radius.
As the device now had TWO Wi-Fi profiles, it was now free to use its inbuilt prioritisation list (more details here) ensuring that the device joined the more secure of the networks (802.1x based, rather than WPA2 / PSK based). Once we were sure that all devices were online and checking in to MDM, we then removed the cert profile from the devices that were only used for Lead Retrieval, as the applications used for this were internet facing. Registration devices connect to an application that’s actually on the Black Hat network, hence the difference in network requirements.
For Black Hat USA 2023, we just didn’t have time to formulate a plan for the devices that would allow those that needed to have elevated network authentication capabilities (EAP-TLS in all likelihood), as the devices were not connecting to a Meraki network anymore, which would have enabled them to use the Sentry capability, but instead an Arista network.
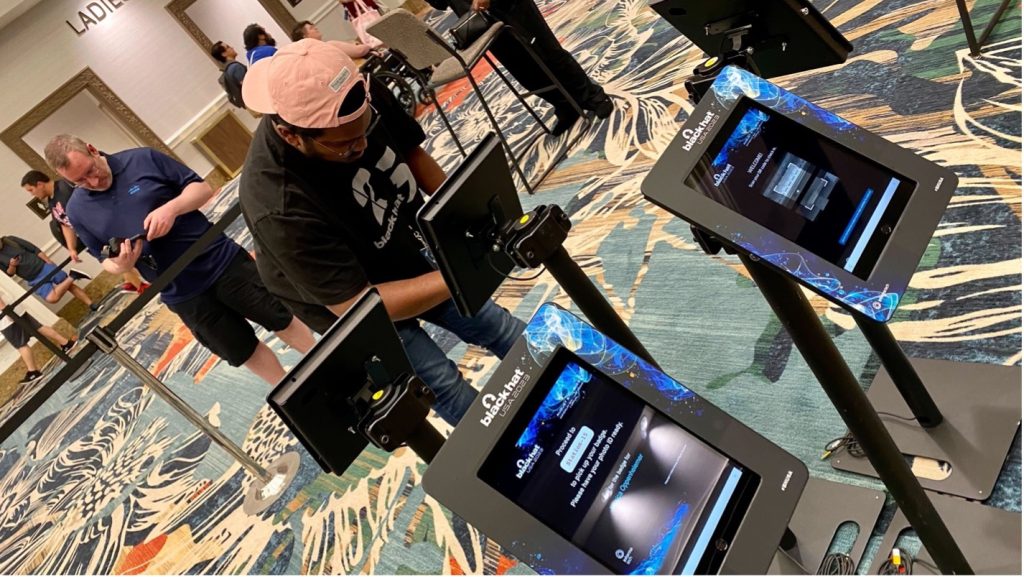
For the future, we can do one of two things:
- Provision ALL devices with the same Wi-Fi creds (either Registration or Attendee) Wi-Fi at the time of enrolment and add the relevant more secure creds (cert, maybe) as they enroll to the Registration iPads ONLY
- More laboriously, provision Registration devices and Session Scanning / Lead Retrieval devices with different credentials at the time of enrolment. This is less optimal as:
- We’d need to know ahead of time which devices are which used for Session Scanning, Lead Retrieval or Registration
- It would introduce the chance of devices being provisioned with the wrong Wi-Fi network creds
When a Wi-Fi profile is introduced at the time of Supervision, it remains on the device at all times and cannot be removed, so option 2 really does have the opportunity to introduce many more issues.
Automation – Renaming devices
Again, we used the Meraki API and a script that goes off, for a given serial number, and renames the device to match the asset number of the device. This has been quite successful and, when matched with a policy showing the Asset number on the Home Screen, makes finding devices quick. However, the spreadsheets can have data errors in them. In some cases, the expected serial number is the device name or even an IMEI. Whilst we can specify MAC, Serial and SM device ID as an identifier, we can’t (yet) supply IMEI.
So, I’ve had to amend my script so that it, when it first runs, gets the entire list of enrolled devices and a basic set of inventories, allowing us to look up things like IMEI, device name, etc., returning a FALSE if still not found or returning the Serial if found. This was then amended further to search the Name key if IMEI didn’t return anything. It could, theoretically, be expanded to include any of the device attributes! However, I think we’d run quickly into false positives.
The same script was then copied and amended to add tags to devices. Again, each device has a persona:
- Registration
- Lead Retrieval
- Session Scanning
Each persona has a different screen layout and application required. So, to make this flexible, we use tags in Meraki Systems Manager speak. This means that if you tag a device, and tag a setting or application, that device gets that application, and so on. As Systems Manager supports a whole bunch of tag types, this makes it VERY flexible with regards to complex criteria for who gets what!
However, manually tagging devices in the Meraki Dashboard would take forever, so we can utilise an API to do this. I just had to change the API call being made for the renaming script, add a new column into the CSV with the tag name, and a couple of other sundry things. However, it didn’t work. The problem was that the renaming API doesn’t care that the ID that is used: MAC, Serial or SM Device ID. The Tagging API does, and you must specify which ID that you’re using. So, I’d changed the Alternative Device ID search method to return serial instead of SM device ID. Serial doesn’t exist when doing a device lookup, but SerialNumber does! A quick edit and several hundred devices had been retagged.
Of course, next time, all of this will be done ahead of time rather than at the conference! Having good data ahead of time is priceless, but you can never count on it!
Caching Server
Downloading iOS 16.6 is a hefty 6GB download. And whilst the delta update is a mere 260MB, this is still impactful on the network. Whilst the download takes some time, this could be massively improved by using a caching server. Whilst there’s many different ways that this could be achieved, we are going to research using the caching capability built into macOS (please see documentation here). The rational for this is that:
- It supports auto discover, thus there’s no need to build the content caching at the edge of the network. It can be built anywhere, and the devices will auto discover this
- It’s astoundingly simple to set up
- It will be caching both OS (Operating System) updates AND application updates
Whilst there wasn’t time to get this set up for Black Hat USA 2023, this will be put into production for future events. The one thing we can’t solve is the humongous amount of time the device needs to prepare a software update for installation!
Wireless
Predictably (and I only say that because we had the same issue last year with Meraki instead of Arista doing the Wi-Fi), the Registration iPads suffered from astoundingly poor download speeds and latency, which can result in the Registration app hanging and attendees not being able to print their badges.
We have three requirements in Registration:
- General Attendee Wi-Fi
- Lead Retrieval and Session Scanning iOS devices
- Registration iOS devices
The issue stems from when both Attendee SSID and Registration SSID are being broadcast from the same AP. It just gets hammered, resulting in the aforementioned issues.
The takeaway from this is:
- There needs to be a dedicated SSID for Registration devices
- There needs to be a dedicated SSID throughout Black Hat for Sessions Scanning and Lead Retrieval (This can be the same SSID, just dynamic or identity (naming changes depending on vendor) PSK)
- There needs to be dedicated APs for the iOS devices in heavy traffic areas and
- There needs to be dedicated APs for Attendees in heavy traffic areas
Lock Screen Message
Again, another learning that came too late. Because of the vulnerability that was fixed in iOS 16.6 (which came out the very day that the devices were shipped from Choose2Rent to Black Hat, who prepared them), a considerable amount of time was spent updating the devices. We can add a Lock Screen message to the devices, which current states: ASSET # – SERIAL # Property of Swapcard
Given that a visit to a simple webpage was enough to make the device vulnerable, it was imperative that we updated as many as we could.
However, whilst we could see with ease the OS version in Meraki Systems Manager, this wasn’t the case on the device: You’d have to go and open Settings > General > About to get the iOS Version.
So, the thoughts occurred to me to use the Lock Screen Message to show the iOS version as well! We’d do this with a simple change to the profile. As the OS Version changes on the device, Meraki Systems Manager would see that the profile contents had changed and push the profile again to the device! One to implement for the next Black Hat!
The Ugly….
On the evening of the day of the Business Hall, there was a new version of the Black Hat / Lead Retrieval app published in the Apple App Store. Unfortunately, unlike Android, there’s no profiles for Apple that determine the priority of App updates from the App Store. There is, however, a command that can be issued to check for and install updates.
In three hours, we managed to get nearly 25% of devices updated, but, if the user is using the app at the time of the request, they have the power to decline the update.
The Frustrating…
For the first time, we had a few devices go missing. It’s uncertain as to whether these devices are lost or stolen, but…
In past Black Hat events, when we’ve had the synergy between System Manager and Meraki Wi-Fi, it’s been trivial, as inbuilding GPS (Global Positioning System) is not existent, to have a single click between device and AP and vice versa. We’ve obviously lost that with another vendor doing Wi-Fi, but, at the very least, we’ve been able to feed back the MAC of the device and get an AP location.
However, the other frustrating thing is that the devices are NOT in Apple’s Automated Device Enrollment. This means that we lose some of the security functionality: Activation Lock, the ability to force enrollment into management after a device wipe, etc.

All is not lost though: Because the devices are enrolled and supervised, we can put them into Lost Mode which locks the device, allows us to put a persistent message on the screen (even after reboot) and ensure that the phone has an audible warning even if muted.
You can find the code and guide at this GitHub repository and the guide in this blog post.
SOC Cubelight, by Ian Redden
The Black Hat NOC Cubelight was inspired by several projects primarily the 25,000 LED Adafruit Matrix Cube (Overview | RGB LED Matrix Cube with 25,000 LEDs | Adafruit Learning System). Other than the mounting and orientation of this 5-sided cube, that is where the Cubelight differs from other projects.
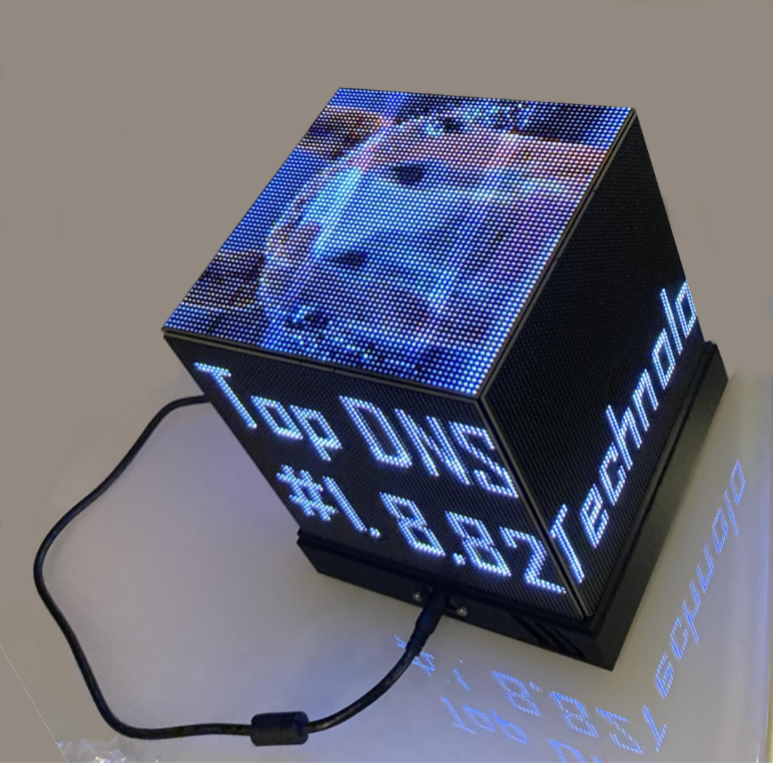
The Raspberry Zero 2W powered light uses custom written Python to display alerts and statistics from:
- Cisco Umbrella
- Top DNS Categories
- NetWitness
- Number of clear-text passwords observed and protocol breakdown
- TLS encrypted traffic vs non-encrypted traffic
- Cisco ThousandEyes
- BGP Reachability
- Total Alerts
- DNS Resolution in milliseconds
- HTTP Server Availability (%)
- Endpoint Average Throughput (Mbps)
- Endpoint Latency

![]()

Automating the Management of Umbrella Internal Networks, by Christian Clausen
The Black Hat network is in fact a collection of over 100 networks, each dedicated to logical segments including the NOC infrastructure, individual training classes, and the public attendee wireless. DNS resolution for all these networks is provided by Umbrella Virtual Appliances: local resolvers deployed onsite. These resolvers helpfully provide the internal IP address (and therefore network subnet) for DNS queries. This information is useful for enrichment in the SOAR and XDR products used by NOC staff. But rather than having to manually reference a spreadsheet to map the specific network to a query, we can automatically label them in the Umbrella reporting data.
Cisco Umbrella allows for the creation of “Internal Networks” (a list of subnets that map to a particular site and label).

With these networks defined, NOC staff can see the name of the network in the enriched SOAR and XDR data and have more context when investigating an event. But manually creating so many networks would be error prone and time-consuming. Luckily, we can use the Umbrella API to create them.
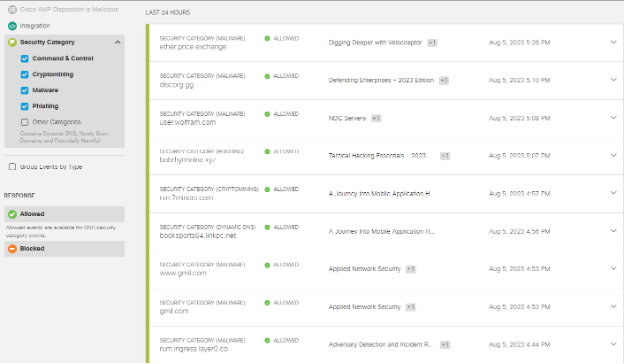
The network definitions are maintained by the Black Hat NOC staff in a Google Sheet; and is continuously updated as the network is built, and access points deployed. To keep up with any changes, we leveraged the Google Sheets API to constantly poll the network information and reconcile it with the Umbrella Internal Networks. By putting this all together in a scheduled task, we can keep the network location data accurate even as the deployment evolves and networks move.
DNS Visibility, Statistics, and Shoes by Alex Calaoagan
Another Black Hat has come and gone, and, if DNS traffic is any indication, this was by far the biggest with close to 80 million DNS requests made. In comparison, last year we logged just over 50 million. There are several factors in the jump, the primary being that we now, thanks to Palo Alto Networks, capture users that hardcode DNS on their machines. We did the same thing in Singapore.
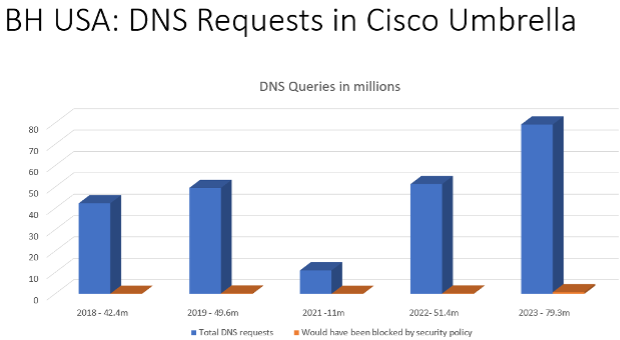
If you missed it, here’s the gist: Palo Alto Networks NAT’ed the masked traffic through our Umbrella virtual appliances on site. Traffic previously masked was now visible and trackable by VLAN. This added visibility improved the quality of our statistics, supplying data that was previously a black box. Check back in 2024 to see how this new information tracks.

Digging into the numbers, we witnessed just over 81,000 security events, a huge drop off from recent years. 1.3 million requests were logged last year, however that number was heavily driven by Dynamic DNS and Newly Seen domain events. Take away those two high volume categories, and the numbers track much better.
As always, we continue to see a rise in app usage at Black Hat:
- 2019: ~3,600
- 2021: ~2,600
- 2022: ~6,300
- 2023: ~7,500

Two years removed from the pandemic, it seems that Black Hat is back on its natural growth trajectory, which is awesome to see.
Looking at Social Media usage, you can also see that the crowd at Black Hat is still dominated by Gen X-ers and Millennials with Facebook being #1, though the Gen Z crowd is making their presence felt with TikTok at #2. Or is this an indication of social media managers being savvier? I’m guessing it’s a bit of both.
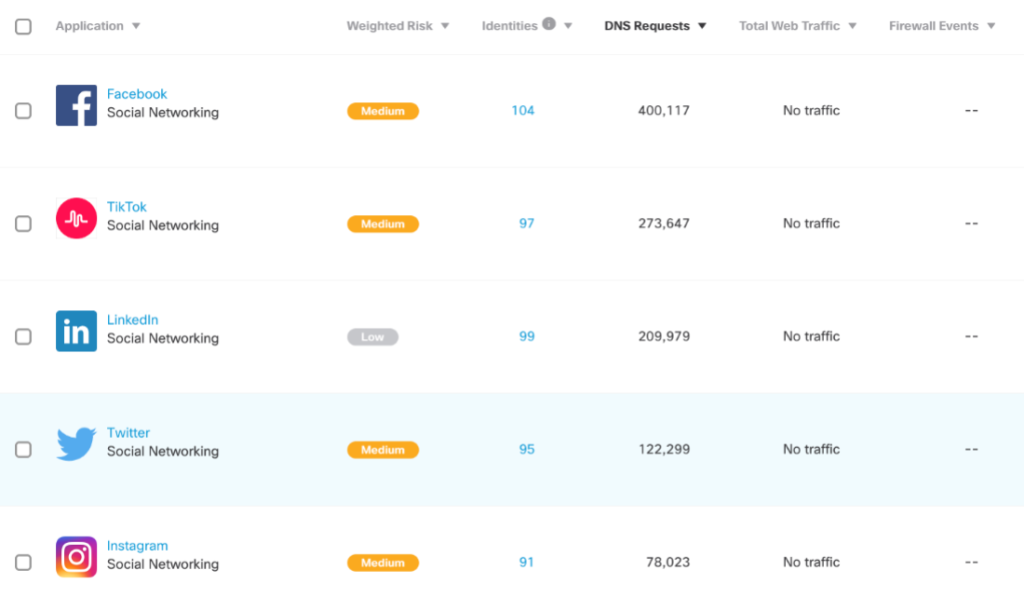
Curious what dating app dominated Black Hat this year? Tinder outpaced Grindr with over double the requests made.


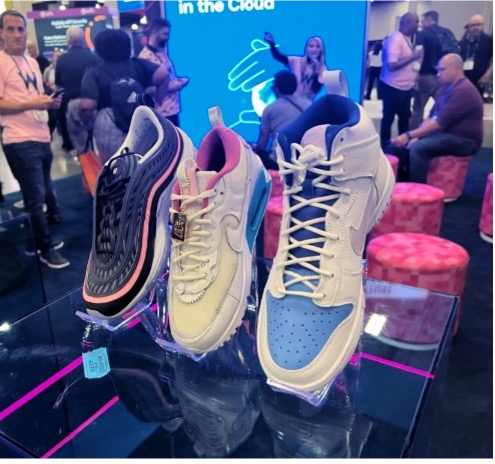
Among the many trends I saw on the show floor, one really stuck with me, and it’s one all Vendors hopefully paid close attention to.
Of all the presentations and demoes I watched or saw gathered, one single giveaway drew the largest and most consistent crowds (and most leads).
It’s an item near and dear to my heart, and if it’s not near and dear to your heart, I’m sure it is to someone in your circle. Whether it’s for your kids, wife, partner, or close friend, when you’re away from your loved ones for an extended period, nothing fits better as an” I missed you” conference gift, unless the attendee is going after it for themselves.
What is it, you ask? Shoes. Nikes to be specific. Jordans, Dunks, and Air Maxes to be even more specific. I counted three booths giving away custom kicks, and every drawing I witnessed (signed up for two myself) had crowds flowing into aisles, standing room only. And yes, like someone you likely know, I’m a Sneakerhead.
Black Hat has always had a nice subculture twang to it, though it has dulled over the years. You don’t see many extreme mohawks or Viking hats these days. Maybe that fun still exists at Defcon, but Black Hat is now all Corporate, all the time. A lot has changed since my first Black Hat at Caeser’s Palace in 2011, it really is a shame. That’s why seeing sneaker giveaways makes me smile. They remind me of the subculture that defined Black Hat back in the day.
The Black Hat show floor itself has become a Nerd/Sneakerhead showcase. I saw a pair of Tiffany Dunks and several different iterations of Travis Scott’s collabs. I even saw a pair of De La Soul Dunks (one of my personal favorites, and very rare). I think high end kicks have officially become socially acceptable as business casual, and it warms my heart.
The moral of this little observation? Vendors, if you’re reading this and have had trouble in the lead gathering department, the answer is simple. Shoes. We need more shoes.
Cheers from Las Vegas ????.
—-
We are proud of the collaboration of the Cisco team and the NOC partners. Black Hat Europe will be in December 2023 at the London eXcel Centre.
Acknowledgments
Thank you to the Cisco NOC team:
- Cisco Secure: Christian Clasen, Alex Calaoagan, Aditya Sankar, Ben Greenbaum, Ryan Maclennan, Ian Redden, Adam Kilgore; with virtual support by Steve Nowell
- Meraki Systems Manager: Paul Fidler and Connor Loughlin
- Talos Incident Response: Jerzy ‘Yuri’ Kramarz
Also, to our NOC partners: NetWitness (especially David Glover, Iain Davidson and Alessandro Zatti), Palo Alto Networks (especially Jason Reverri), Corelight (especially Dustin Lee), Arista (especially Jonathan Smith), Lumen and the entire Black Hat / Informa Tech staff (especially Grifter ‘Neil Wyler,’ Bart Stump, Steve Fink, James Pope, Mike Spicer, Sandy Wenzel, Heather Williams, Jess Stafford and Steve Oldenbourg).

About Black Hat
For 26 years, Black Hat has provided attendees with the very latest in information security research, development, and trends. These high-profile global events and trainings are driven by the needs of the security community, striving to bring together the best minds in the industry. Black Hat inspires professionals at all career levels, encouraging growth and collaboration among academia, world-class researchers, and leaders in the public and private sectors. Black Hat Briefings and Trainings are held annually in the United States, Europe and USA. More information is available at: Black Hat.com. Black Hat is brought to you by Informa Tech.
We’d love to hear what you think. Ask a Question, Comment Below, and Stay Connected with Cisco Secure on social!
Cisco Secure Social Channels
Instagram
Facebook
Twitter
LinkedIn
Source: cisco
Source Link: https://blogs.cisco.com/security/black-hat-usa-2023-noc-network-assurance